vllm-radiance vs radiance: the evidence side by side
The engine story depends on which column you read. In the closest workload family, vllm-radiance has shorter non-speculative wall times, while radiance has shorter MTP-4 wall times. Generation estimates and first-token latency tell a more mixed story. Here are the observations, their denominators and the differences that prevent a controlled engine verdict.
For each stack’s configurations and practical operating range, use the dedicated vllm-radiance and radiance pages.
The comparison contract
These are historical deployments on one Minisforum MS-01, 32 GB host RAM, with two R9700 32 GB GPUs. GPU A uses PCIe 4.0 ×8; GPU B uses ×4 through an adapter/redriver. Hardware details.
| Variable | vllm-radiance Y/Z references · 19 Oct | radiance R1–R6 · 21 Oct |
|---|---|---|
| Engine | 1.1.0-rc1.vllm0.30.0 |
stilldeadcode/radiance 1.9.0 |
| Exported target / serving name | ukisai/Swift-1.5-Qwen3.8-27b-W4A16-AWQ |
Same API name; converted .rad bundle |
| Recorded revision | 9dba8a05 |
81a28ee75eb1cd469f209813a368a79a7e3db3bc |
| Weight representation | AWQ INT4 / W4A16 | awq-int4-rad; conversion notes name the Swift-1.5 INT4 source |
| Attention KV | BF16 | FP8 |
| TP / slots / host tier | 2 / 4 / 10 GiB ARC | 2 / 4 / 10 GiB prefix tier |
| Server context limit | 131,070 | 131,072 |
| Workload | Ten turns per agent, 126k growth target | Same recovered harness/workload family |
| Repeated alongside the new run? | No | New measurements on 21 Oct |
Sources: Y/Z sweep CSV, radiance campaign CSV, model identities. The recovered harness hash is recorded in the data dictionary. A shared serving name and harness do not prove identical weights, tokenization or cache behaviour.
The 19 October sweep included repeat non-speculative Swift-Quark cells around 373–439 s. That roughly 15% spread is evidence of variability in that setup, not a confidence interval or a universal threshold for the Y/Z and radiance comparisons. There are no matched repeat distributions here to establish statistical significance.
Dual-card wall time
Wall is the elapsed time for the whole cell: ten turns per agent, including waiting and prompt processing. Lower is better. All 16 text rows below are observations, not projected performance.
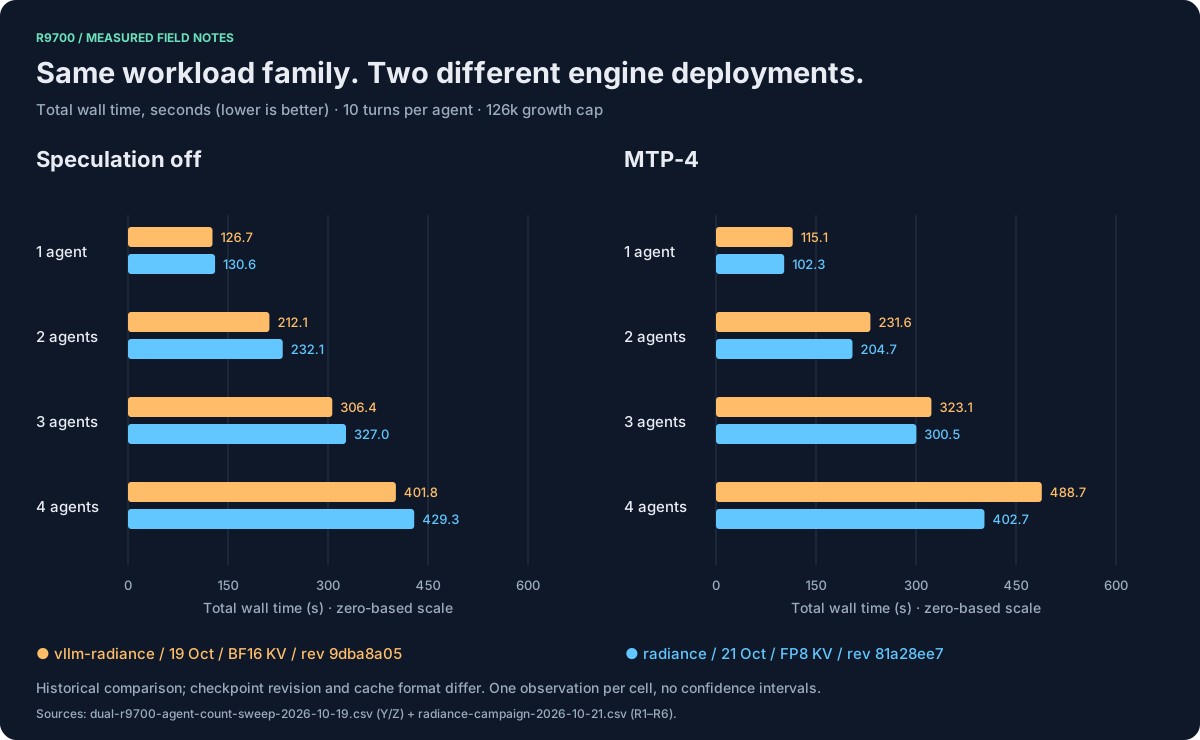
| Agents | vllm-radiance non-spec · Y | radiance non-spec · R1–R4 | Relative change | vllm-radiance MTP-4 · Z | radiance MTP-4 · R6 | Relative change |
|---|---|---|---|---|---|---|
| 1 | 126.7 s | 130.6 s | +3.1% | 115.1 s | 102.3 s | −11.1% |
| 2 | 212.1 s | 232.1 s | +9.4% | 231.6 s | 204.7 s | −11.6% |
| 3 | 306.4 s | 327.0 s | +6.7% | 323.1 s | 300.5 s | −7.0% |
| 4 | 401.8 s | 429.3 s | +6.8% | 488.7 s | 402.7 s | −17.6% |
Relative change = (radiance / named vllm-radiance baseline − 1) × 100. Positive wall change means more time. Source cells: Y1–Y4 / Z1–Z4 in the sweep, R1–R4 / R6-mtp4-n1…n4 in the radiance grid.
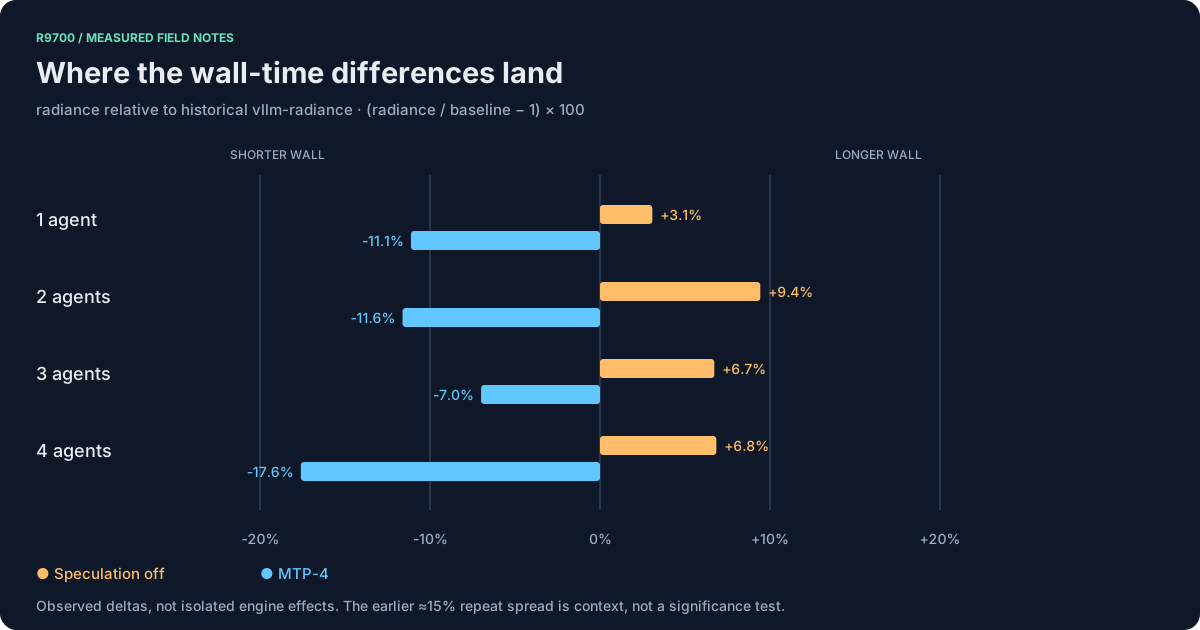
Radiance MTP-4 also has shorter observed walls than radiance’s own non-speculative lane: 21.7%, 11.8%, 8.1% and 6.2% at n=1–4. At four agents it is 0.2% longer than historical vllm-radiance non-spec: 402.7 vs 401.8 s. The choice of baseline changes the headline.
The synthetic image-input cell is separate: 685.7 vs 651.9 s, radiance non-spec vs Y5, 5.2% longer. These are procedural screenshots, not the real coding fleets. Radiance’s 13 GiB-tier R9 records 402.0 s vs 402.7 s at 10 GiB; that 0.7 s gap does not establish a tier-speed benefit.
Latency and generation
Three metrics answer three different questions. TTFT measures the wait for first streamed content, including queueing. Mean turn TG averages completion tokens ÷ (request wall − TTFT) over valid turns. End-to-end output rate divides total successful output tokens by the whole cell wall, including prompt work and waits. Neither rate is raw kernel decode speed.
Both tables below compare the MTP-4 lanes: old Z1–Z4 vs new R6-n1…n4. Rates and averages are as exported; short outputs and streaming behaviour make TG estimates sensitive to accounting.
| Agents | Mean TTFT: vllm-radiance / radiance | Mean turn TG: vllm-radiance / radiance | End-to-end output: vllm-radiance / radiance |
|---|---|---|---|
| 1 | 10.82 / 8.37 s | 185.7 / 137.9 tok/s | 12.94 / 24.79 tok/s |
| 2 | 5.69 / 10.72 s | 42.0 / 41.0 tok/s | 19.75 / 24.97 tok/s |
| 3 | 16.65 / 12.85 s | 68.5 / 25.9 tok/s | 16.14 / 24.29 tok/s |
| 4 | 20.67 / 17.10 s | 36.9 / 16.8 tok/s | 16.35 / 24.56 tok/s |
Sources: the same Y/Z sweep and radiance grid. The export columns are ttft_avg_s, turn_tg_avg / tg_avg_tokens_s, and decode_tokens_s. Output quantity is model-generated and can vary; higher aggregate output rate does not mean greater task productivity.
At n=1, radiance MTP-4 shows 25.7% lower mean turn TG, 91.6% higher end-to-end output rate and 11.1% shorter wall. At n=2, its mean TTFT is 88.4% higher. Those counterpoints belong beside the favourable wall-time result.
Within radiance at n=1, turning MTP-4 on changes mean turn TG 54.4 → 137.9 tok/s (+153.5%) and end-to-end output 19.61 → 24.79 tok/s (+26.4%). The previous write-up’s “+90%” mixed a historical non-speculative baseline into this within-engine explanation; it was not the MTP gain.
Deep bands and shallow bands
Selected non-speculative depth bands show lower radiance TTFT than historical Y cells:
| Agents / depth band | vllm-radiance Y | radiance R | Observed change |
|---|---|---|---|
| 1 / 60–90k | 11.79 s | 8.32 s | −29.4% |
| 2 / 90–120k | 22.77 s | 10.19 s | −55.2% |
| 3 / 90–120k | 29.08 s | 10.37 s | −64.3% |
| 4 / 90–120k | 34.94 s | 10.67 s | −69.5% |
| 3 / 0–30k | 1.78 s | 14.32 s | +704.5% |
This is a selection of bands, not an all-depth speedup. The historical n=2 shallow-band 0.0 is a no-sample marker, not zero latency, so no percentage is calculated from it. The released data does not isolate the mechanism behind these differences.
PP: leave the missing benchmark missing
No validated matched kernel PP measurement is available. The sweep’s pp_effective_ingest_tok_s uses prompt tokens ÷ TTFT and includes the effects of cache reuse. Monitor intake rates and bursty prompt-credit counters have different meanings again. Substituting those into a prefill leaderboard would manufacture a comparison the tests did not run. Definitions and formulas.
Single card: compare depth before latency
The 18 October single-card vllm-radiance profile uses MTP-4, FP8 KV and a 10 GiB tier; radiance TP1 uses MTP-4, FP8 KV and 13 GiB. The checkpoint representations and turn histories differ. At four agents, radiance has a 29.4% smaller growth cap, 88,913 vs 126,000 tokens.
| Four-agent observation | vllm-radiance GPU A | radiance TP1 |
|---|---|---|
| Timed turns, total | 114 | 32 |
| Growth stopping target | 126,000 | 88,913 |
| Maximum observed prompt | 126,691 | 99,075 |
| Mean / maximum TTFT | 101.38 / 654.91 s | 14.34 / 22.02 s |
| Reported request / turn generation estimate | 25.5 tok/s | 17.4 tok/s |
| Whole-cell wall ÷ timed turns | 34.65 s | 9.06 s |
Sources: original follow-up, historical config, radiance TP1. The lower radiance mean TTFT is 85.9%; maximum observed depth is 21.8% lower. These paired facts describe a different operating point, not an equal-depth speedup. Complete single-card report.
Memory: allocation is not throughput
The radiance TP2 pool grows 524,304 → 786,448 → 1,228,816 tokens as slots/context change. The original 524k figure was the four-slot target, not the physical two-card ceiling. The later pool represents +134.4% allocated capacity over that first boot. There is no sustained six-agent 200k grid. A host prefix cache stores completed conversation state; it does not add live GPU concurrency. Measured/projection ladder · capacity CSV.
Real tasks: delivery and clean exit
Radiance’s fleet produces 4/4 complete deliveries, 4/4 reported syntax passes, 2/4 clean deliveries: agents 0–1 time out at 3,600 seconds while agents 2–3 exit cleanly. Historical vllm-radiance dual produces 4/4 complete and clean deliveries in 30:10, with reported behaviour checks. Different budgets, context settings and validation scope prevent a coding-quality ranking. Radiance fleet CSV · historical fleet CSV · play the artefacts.
Evidence map
| Finding | Public source / cells |
|---|---|
| Dual wall, TTFT and generation | 19 Oct sweep, Y1–Y5 / Z1–Z5; 21 Oct radiance, R1–R9 |
| Single-card depth/latency | 18 Oct follow-up, gpu-a n1–4; 22 Oct radiance, R1x n1–4 |
| Memory headline | Capacity ladder, measured TP2 four-slot 131k and six-slot 200k rows |
| Fleet headline | Radiance agent outcomes, agents 0–3 |
| Chart reproduction | python3 tools/render_editorial.py; source hashes |
The result is a set of useful operating observations, with different strengths across wall time, first-token latency, output rate, context and completion. It does not establish a universal engine winner.
Home · vllm-radiance · radiance · Charts · Stuff for nerds · Disclosure