ROCm 7.14 vs ROCm 10.1 with vllm-radiance
Benchmarks and how to run them
Research scope: ROCm 7.14 versus ROCm 10.1 using vllm-radiance, with Qwen3.8 27B coding-agent workloads. The primary historical campaign summarised here tested the hybrid ukisai/Swift-1.5-Qwen3.8-27b-INT4 checkpoint on Radiance/vLLM. Historical performance comparisons are specific to this model/checkpoint and the matching software and cache configuration. The rewritten synthetic client can target other models, but those runs are new experiments and must not be presented as results for this campaign. See the Hugging Face model inventory for additional target and draft checkpoints explored in related Radiance work.
The 18 October repeat campaign records the new sequential 1–4-agent matrix and its measurement limits.
Workload design
For the current single-card profile, the four-agent deep-context cell is the final boundary stress point. It establishes the behaviour beyond the apparent usable envelope; completing without client errors is distinct from acceptable latency. Keep the 10 GiB CPU tier fixed. A previous 16 GiB tier caused severe host slowdown and is not the planned remedy. The completed case recorded mean/maximum TTFT of 101.38/654.91 seconds; see the accepted matrix.
The comparison is between recorded runtime deployments. Use matching checkpoint, workload, TP, speculation, context limits, cache budgets and hardware where available. Where the historical profile differs, report that difference and avoid attributing the full performance change to ROCm alone.
One central workload asks how many concurrent coding agents can each sustain roughly 131k tokens of context on one R9700 with a host-RAM KV tier, while retaining useful response latency and completing their work. Report each agent’s observed context, completion and latency alongside the fleet result. Growing towards 131k or configuring a 131k limit alone does not demonstrate sustained operation with every agent at that depth simultaneously.
The campaign used repeated OpenAI-compatible chat turns shaped like coding-agent work. Each agent received a shared system context, a task, then appended simulated tool output before the next turn. Streaming responses made it possible to measure time to first token and inter-token behaviour. Experiments varied agent count, depth cap, tool-result size distribution, compaction, image input, speculative decoding, and KV tier.
The original fixture conversations are not included. The release benchmark client creates deterministic synthetic tool-result text and does not read or transmit source conversation material.
Experiment families
| Family | Question | Typical measures |
|---|---|---|
| Agent fleet scaling | What changes at 1–6 concurrent agents? | TTFT, per-agent decode speed, inter-token p99, errors, wall time |
| Context-depth sweep | How does response behaviour change as histories grow? | TTFT by depth bucket, max depth, KV use, cache hit/transfer flow |
| Compaction | How expensive is repeated context compaction? | Post-compaction TTFT, stalls, queueing, turn completion |
| KV tier/storage | What capacity/latency tradeoff comes from RAM and disk tiers? | GPU/CPU tier signal, transfer rates, host memory, swap, I/O |
| Speculative decode / runtime | Which build and draft settings remain stable? | accepted drafts, generated tokens/s, latency, errors |
| Sanity/stress | Does the recorder or service survive a long run? | request completion, error count, resource traces |
The derived case summary preserves the archived benchmark rows for provenance. The run index summarizes the legacy workload families and explains why their results are not interchangeable version comparisons. See ROCm version evidence for the narrowest available 7.14 versus 10.1 comparison and its limits, and the repeat-campaign ledger for the later 10.1 cases.
Run the new synthetic benchmark
Prerequisites: Python 3.10+ and a running OpenAI-compatible endpoint with a loaded model. The client only uses the Python standard library.
python3 scripts/agent_bench.py \
  --base-url http://127.0.0.1:8000/v1 \
  --model YOUR_MODEL_ID --agents 4 --turns 24 \
  --max-tool-chars 12000 --output data/new-run.json
It sends synthetic requests, records status and timing metrics, and writes a JSON summary. It does not recreate the private original corpus, so results are methodologically related but not exact reproductions of historical rows.
Plot the derived CSVs
python3 tools/render_csv.py data/rocm-7.14/single-card-ram16-tier-four-agents-at-131k-target.csv \
  data/rocm-7.14/single-card-ram16-tier-three-agents-at-150k-target.csv data/rocm-7.14/historical-agent-workloads.csv --out graphs
The SVG renderer uses Python’s standard library. Recorder traces use relative elapsed seconds and derived rates/interval means; case summaries show per-agent decode throughput. Selected telemetry and case summaries have pre-rendered graphs; exploratory SVGs remain in the secondary archive while their performance CSVs are omitted.
The case-summary chart is grouped into sections by concurrent agent count and uses a shared throughput scale. Cases within a group still vary by context target, image workload, and experiment family; use the run index and compare only matching workload conditions. Failed cases remain listed with no throughput bar.
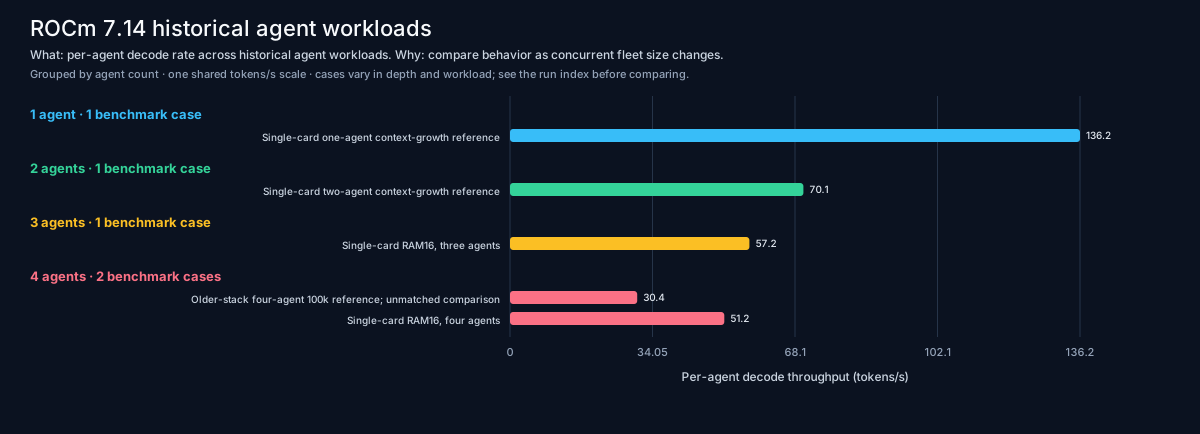
The chart gallery embeds the selected telemetry graphs, with links from each chart to its transformed CSV and run explanation.
Read results carefully
- Compare matching agent count, workload, depth, model/build, cache state, and tier configuration.
- Do not read
prompt_compute_credit_rate_tokens_sas prefill throughput (PP). The source counter credits prompt work in bursts at request completion; dividing by a short scrape interval can produce misleading spikes such as about 65k tokens/s. The released telemetry has no validated per-run PP series, so report PP as unavailable for these traces. - A mean does not reveal long-tail stalls. The four-agent RAM16 result had three turns over 45 seconds despite zero request errors.
- The ROCm 10.1 stress result is not a controlled A/B against the earlier run.
- Device counts and KV capacity do not establish throughput scaling; TP=2 uses the slower second link for collective traffic.
Home · Overview · ROCm 10.1 results · Charts