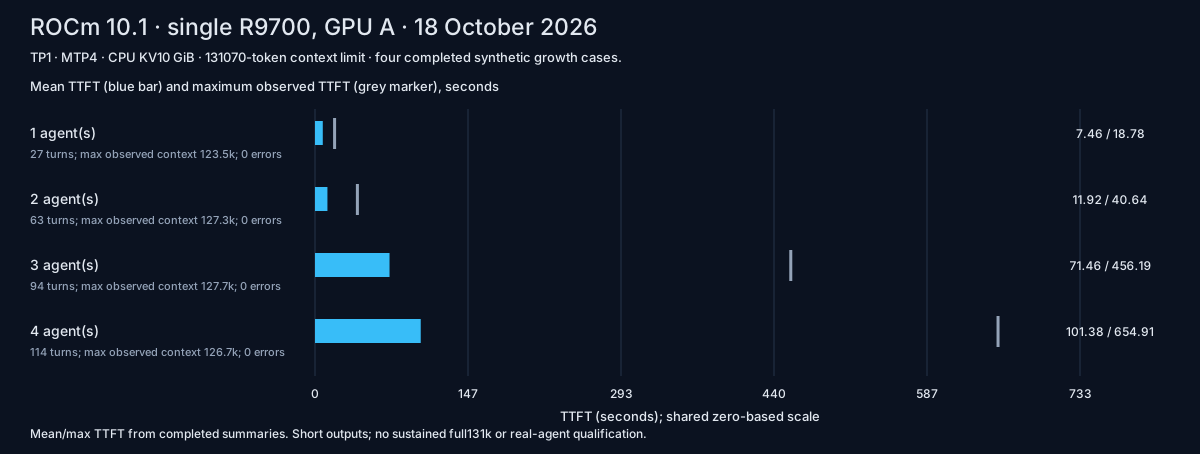
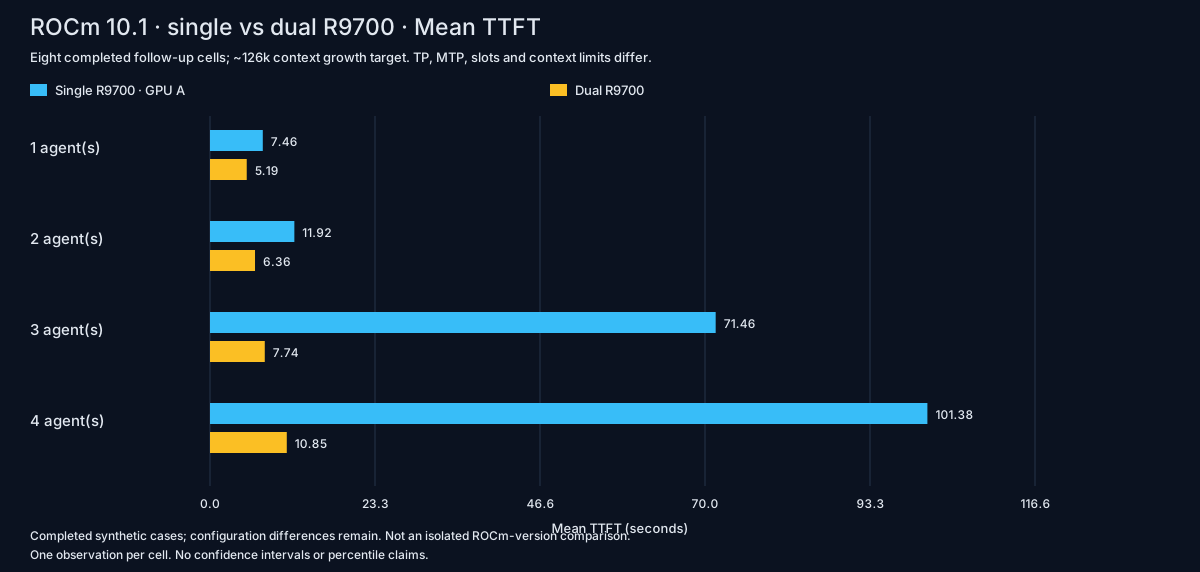
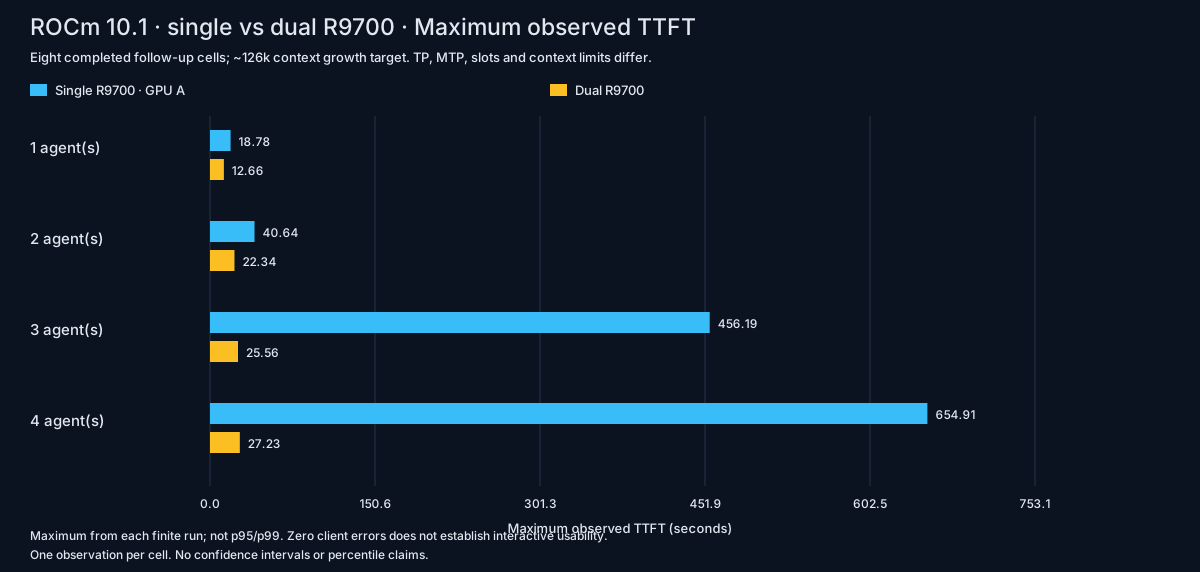
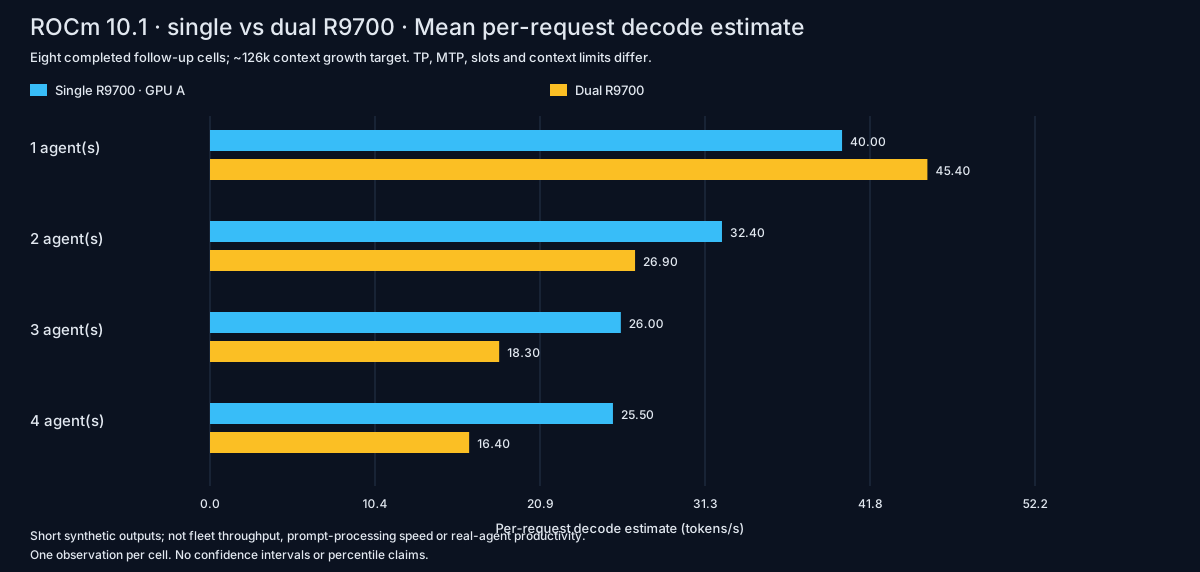
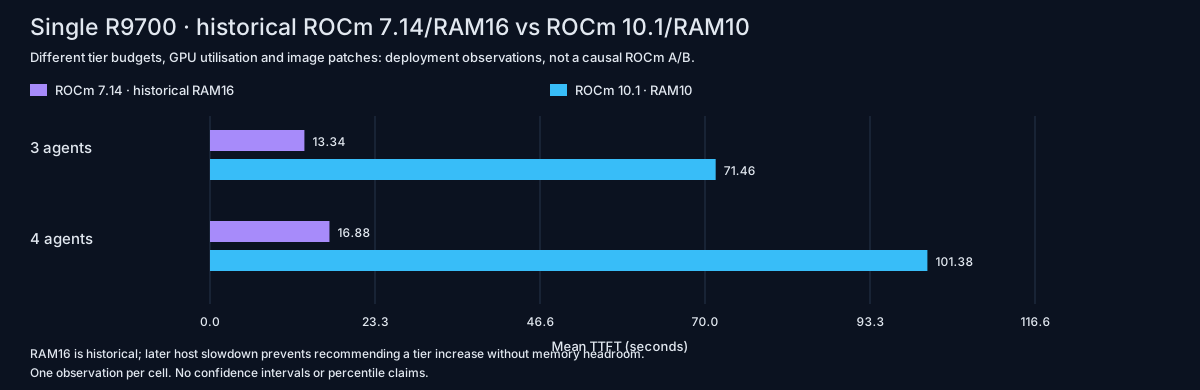
This folder contains the selected results only. Version assignment follows the reviewed catalogue; older traces use profile/date evidence, not per-run immutable image IDs.
What was excluded and why. Different workload/configuration histories are not a controlled ROCm A/B.
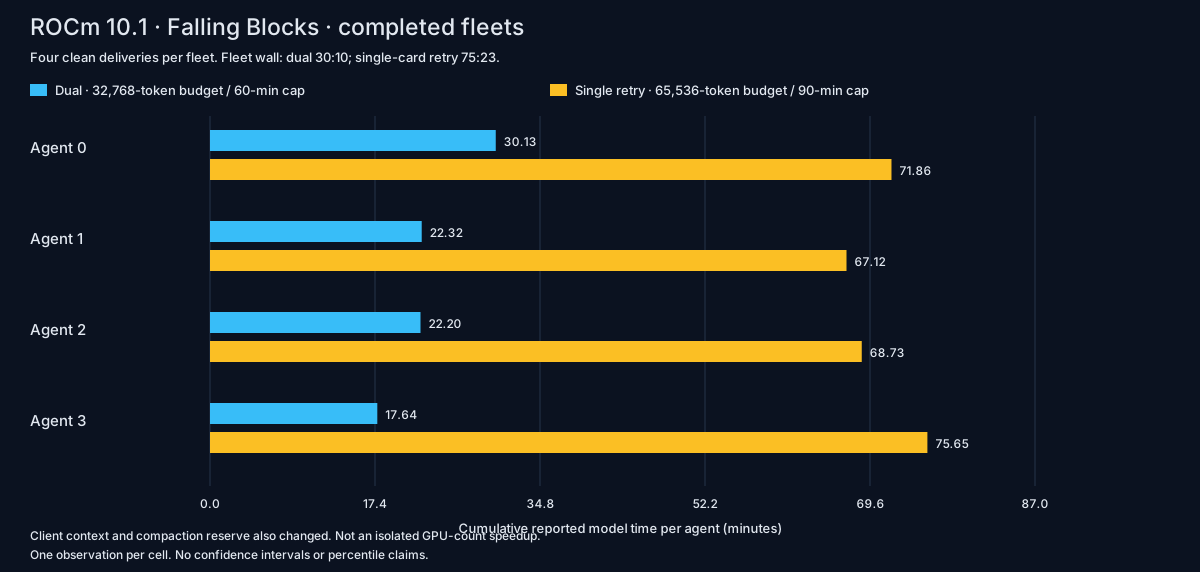
Per-agent model time: dual and successful single-card retry · Play the eleven games. Budget, client context and reserve changed; this is not an isolated hardware speed comparison.
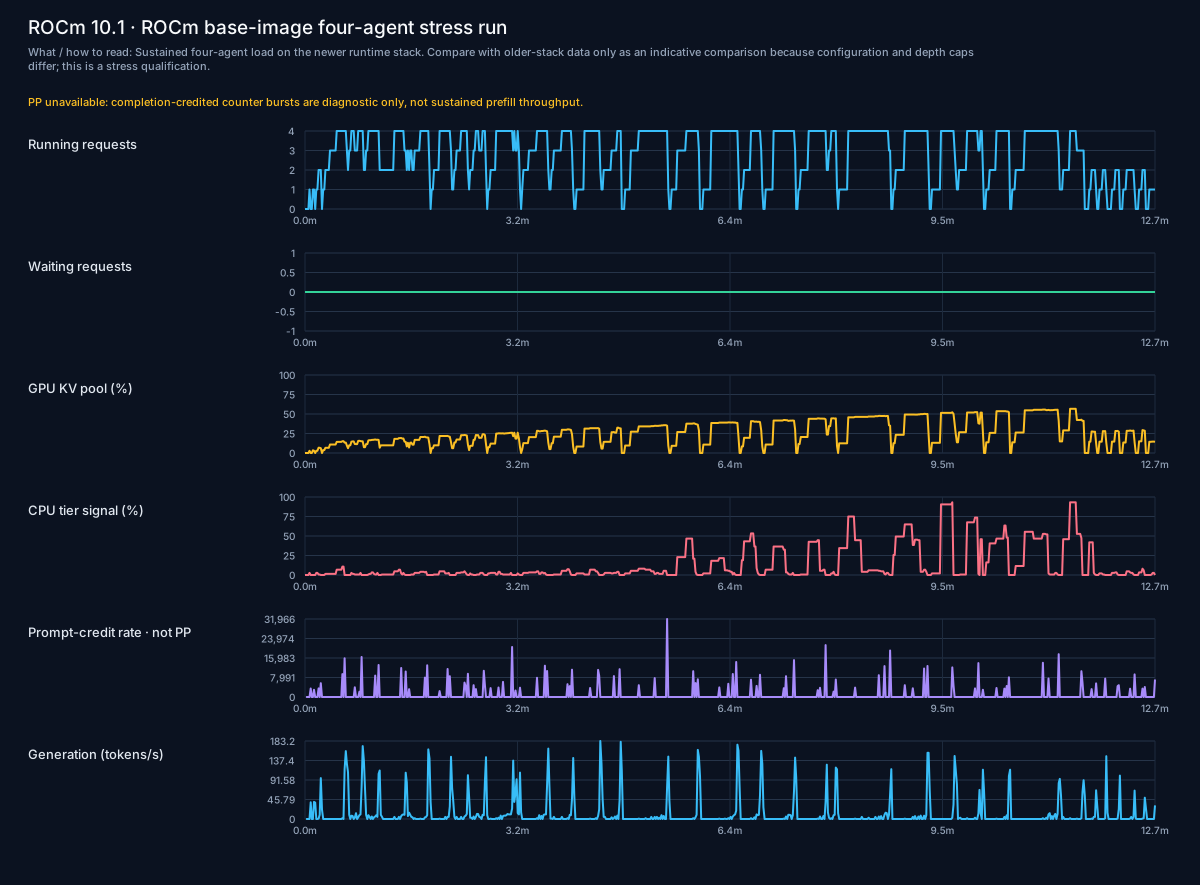
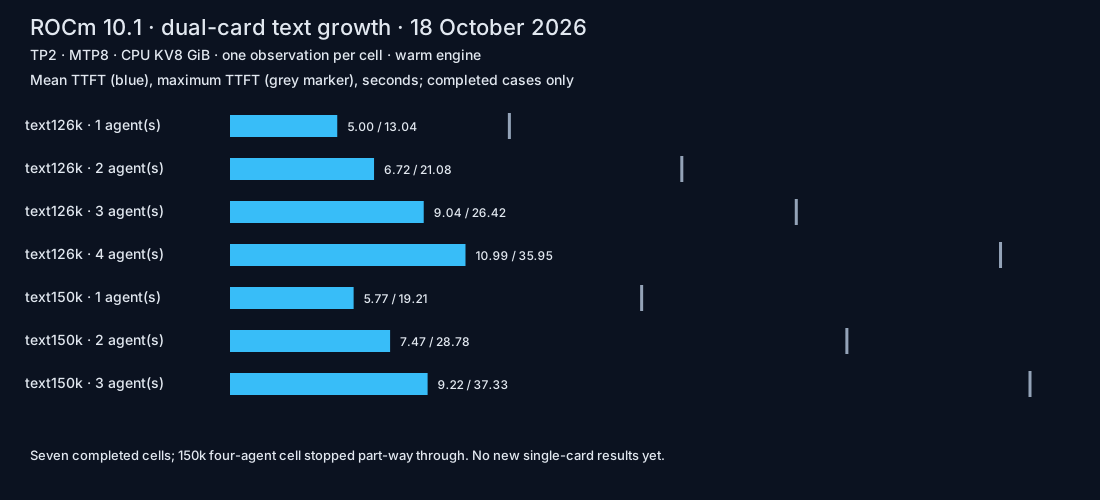
The seven-cell dual chart uses an 8 GiB CPU tier. The later GPU A/dual comparison uses 10 GiB; its shared GPU A rows are also shown in the single-card chart. These are not independent repeat samples. Charts use timed-turn exports; the campaign report explains empty completions, pressure, fleet outcomes and comparison limits.
Home · Overview · ROCm 10.1 results · Charts